
Bitcoin’s latest decline has looked, at first glance, like a routine cooldown — the kind of orderly correction traders have come to expect after periods of strength. But beneath the surface, blockchain data is telling a far more complicated story.
A cluster of on-chain indicators now suggests that the market may be entering a fragile transition phase — one that has historically preceded extended bear cycles rather than short-lived dips.
Profitability Is Shrinking — And That Matters


4
One of the clearest signals comes from the Realized Profit/Loss Ratio, a metric that tracks how much capital exits the market in profit versus loss.
Data tracked by Glassnode shows the ratio’s 90-day moving average slipping into the 1–2 range — a zone that has historically aligned with early bear-market transitions.
In simple terms:
Investors are still taking profits — but far fewer than during bullish expansions.
Loss realization is beginning to creep higher.
Liquidity rotation, the lifeblood of bull markets, is slowing down.
When this ratio drifts toward 1, it signals a market where gains and losses are nearly balanced — a hallmark of weakening momentum.
Unless the metric climbs back above 2, analysts warn that structural softness could linger.
Network Participation Is Quietly Drying Up
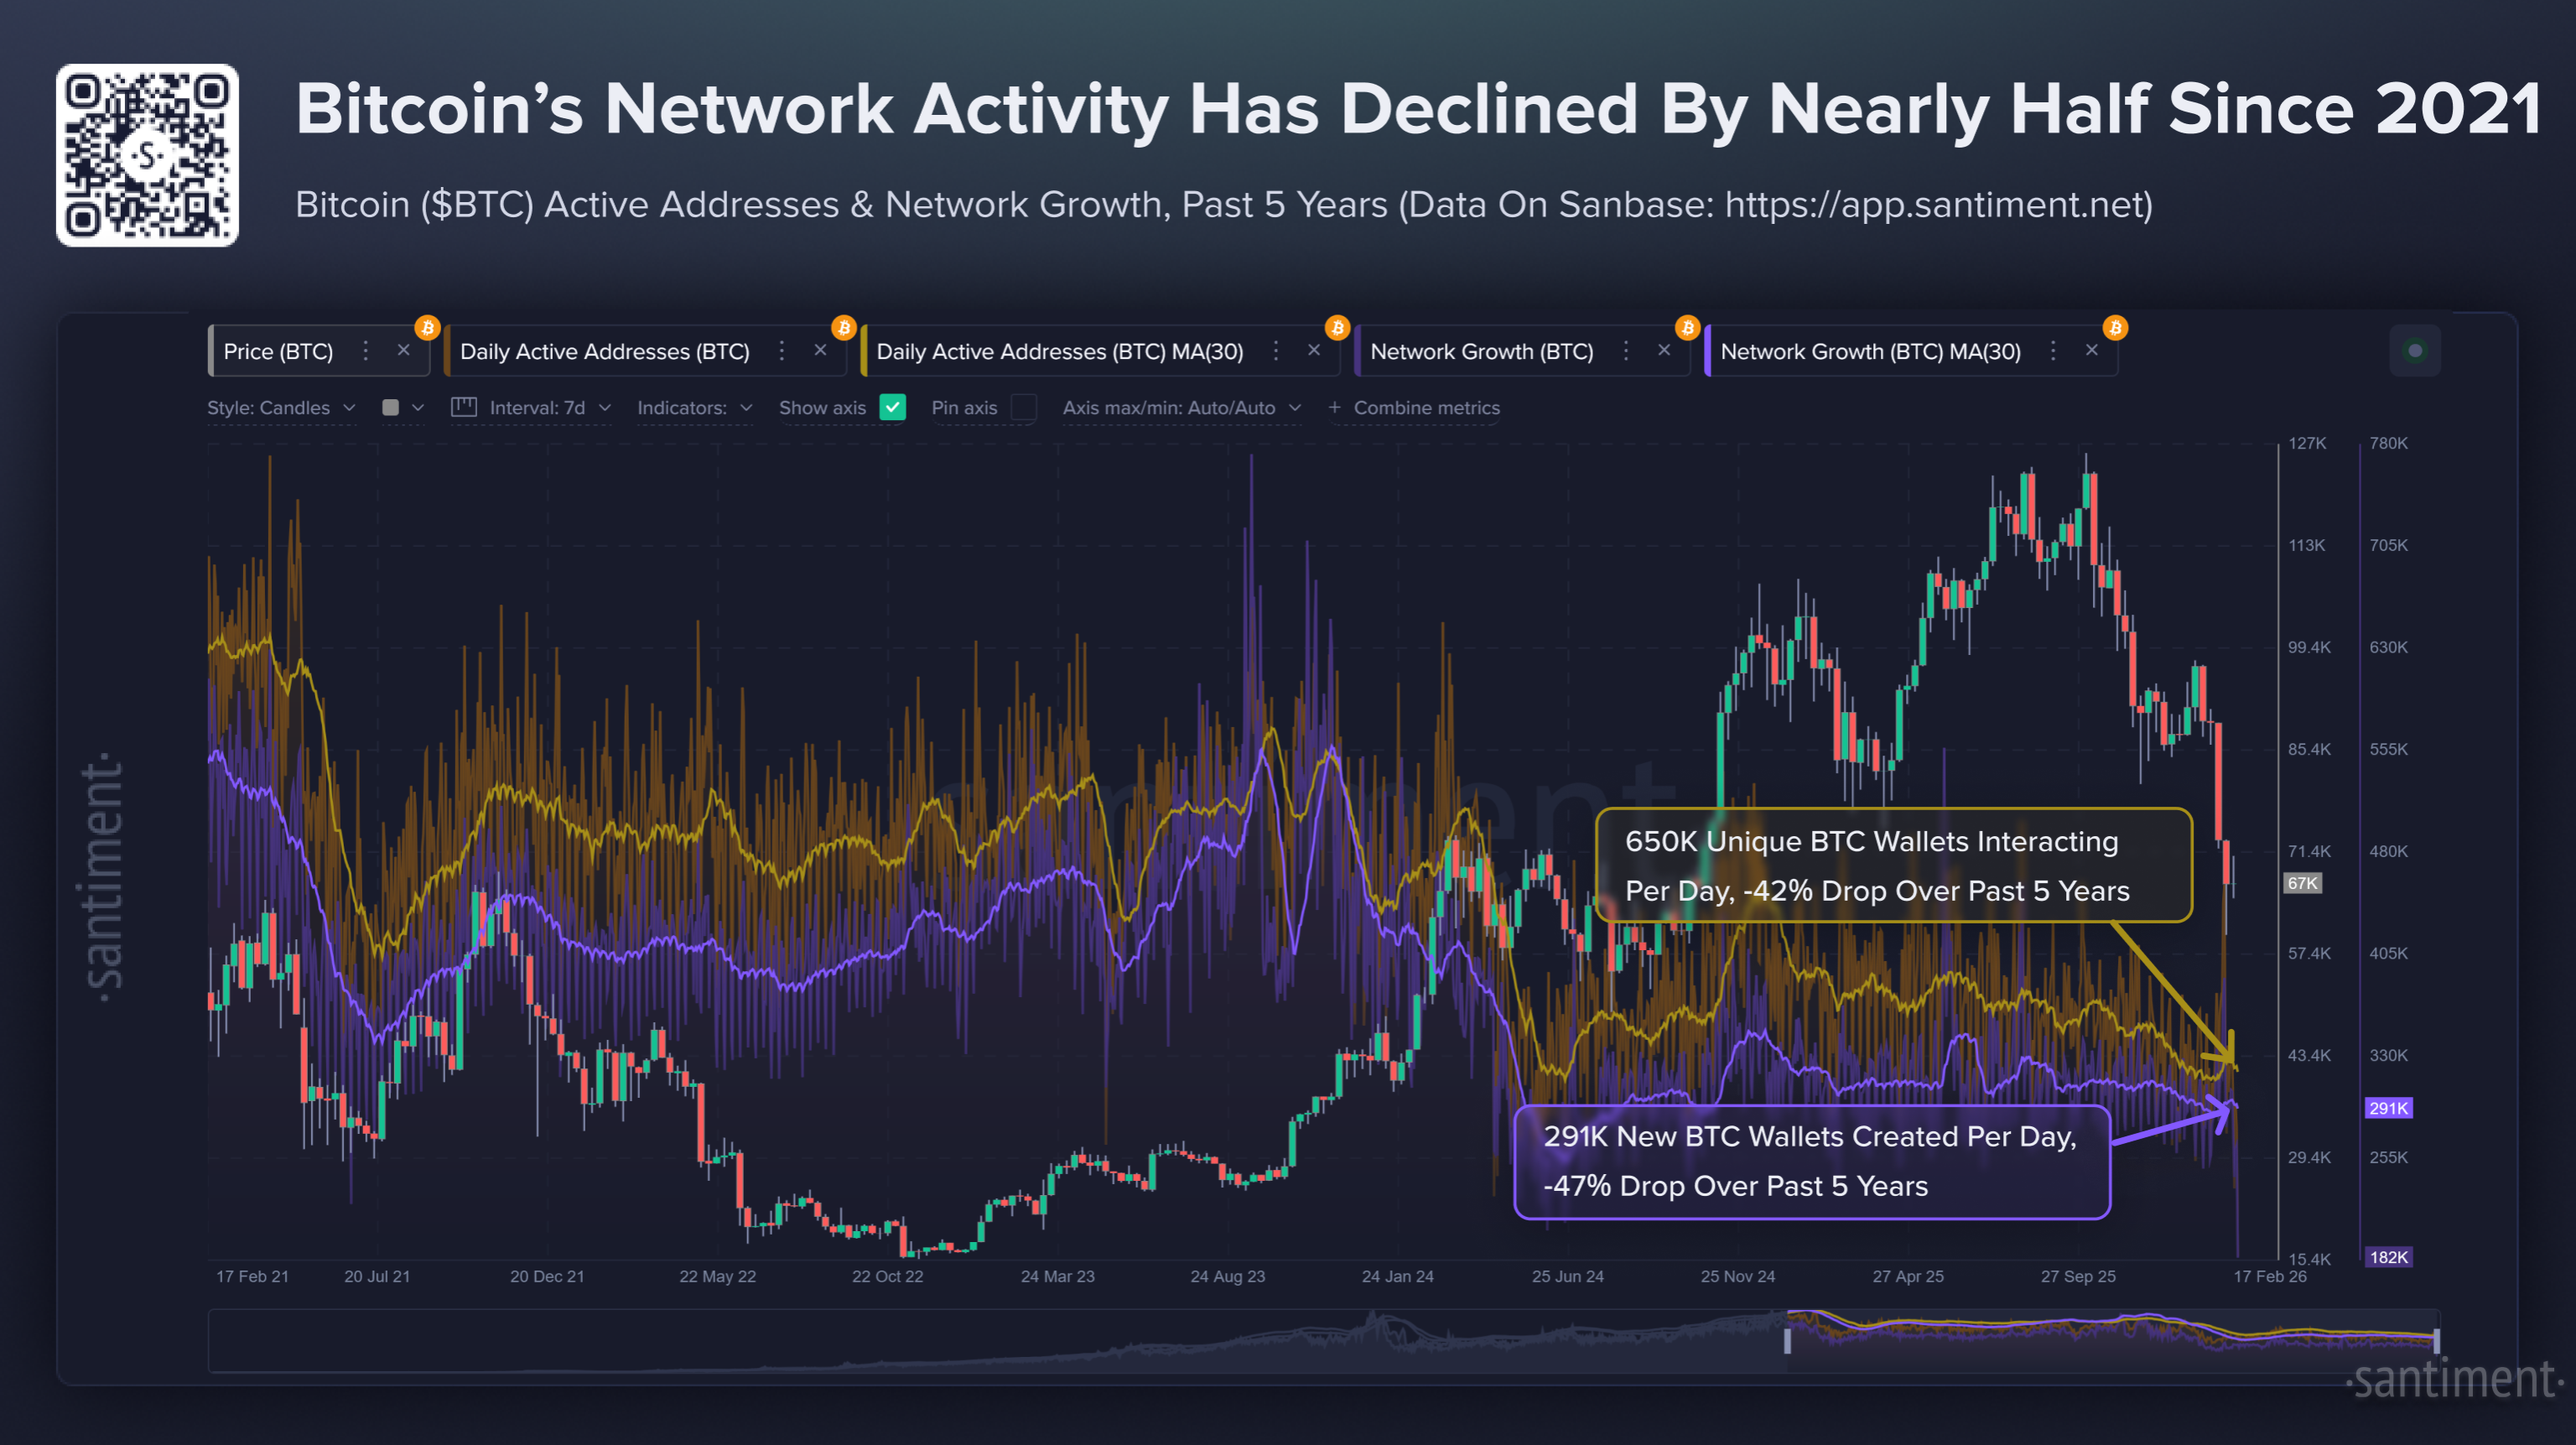
While price has held relatively firm, user activity tells a different story.
According to data from Santiment:
Unique Bitcoin addresses making transactions are down 42% compared to five years ago.
New wallet creation has fallen 47% over the same period.
This divergence — steady prices paired with declining participation — is unusual.
Healthy bull cycles typically feature:
✔ Expanding user bases
✔ Rising transaction counts
✔ Fresh capital entering the ecosystem
Right now, that organic demand engine appears to be idling.
A Critical Support Battle Is Already Underway
At the time of analysis, Bitcoin is trading near $66,700, hovering just above a key defensive level around $66,550.
This price zone has repeatedly prevented sharper breakdowns. But the asset remains locked in a descending trend that began in late January — a technical structure that continues to cap upside momentum.


4
Charts published on TradingView show that failure to reclaim higher resistance could open the door to deeper downside:
A drop toward $60,000 becomes increasingly likely if sellers maintain control.
Losing that level may accelerate selling pressure.
The next major structural support sits near $52,775.
The “Realized Price” Line in the Sand
Another critical benchmark sits lower: Bitcoin’s Realized Price, currently near $54,920.
This level represents the average price at which coins last moved — effectively the market’s aggregate cost basis.
Historically, sustained trading below this threshold has marked the shift from correction to full bear market conditions. A deeper move toward the 1.23 Fibonacci extension would significantly increase the probability of a prolonged downturn.
Why the Picture Isn’t Fully Bearish — Yet
Despite these warning signs, the data has not reached the levels typically associated with late-stage capitulation.
Several recovery triggers remain in play:
A decisive rebound from $66,550 could stabilize sentiment.
Breaking above $71,693 would challenge the current downtrend.
Reclaiming the short-term 20-day EMA would signal renewed momentum.
A confirmed push beyond $80,000 would restore confidence in a longer-term bull structure.
In other words, the market is not broken — but it is undeniably strained.
A Market in Transition, Not Collapse
What makes the current environment unusual is its ambiguity.
This is not the euphoric blow-off that ends bull runs.
Nor is it the panic-driven unwinding typical of deep bear markets.
Instead, Bitcoin appears stuck in a structural gray zone — where capital is cautious, participation is thinning, and conviction has yet to return.
For investors, that creates a paradox:
The absence of dramatic selling may feel reassuring.
But historically, it’s exactly this quiet weakening that has preceded longer, grinding cycles.
The Takeaway
Bitcoin’s latest pullback may look calm on the surface, but underlying metrics suggest the market is testing a pivotal transition. Whether this becomes a reset within an ongoing expansion — or the early stages of a broader bear phase — will likely depend on one factor above all:
The return of real participation and fresh liquidity.
Until then, the market remains balanced on a knife’s edge — stable in price, but searching for conviction.